Density
Thousands of data points across exits, deals and portfolio health, and every one of them matters to somebody in the room.

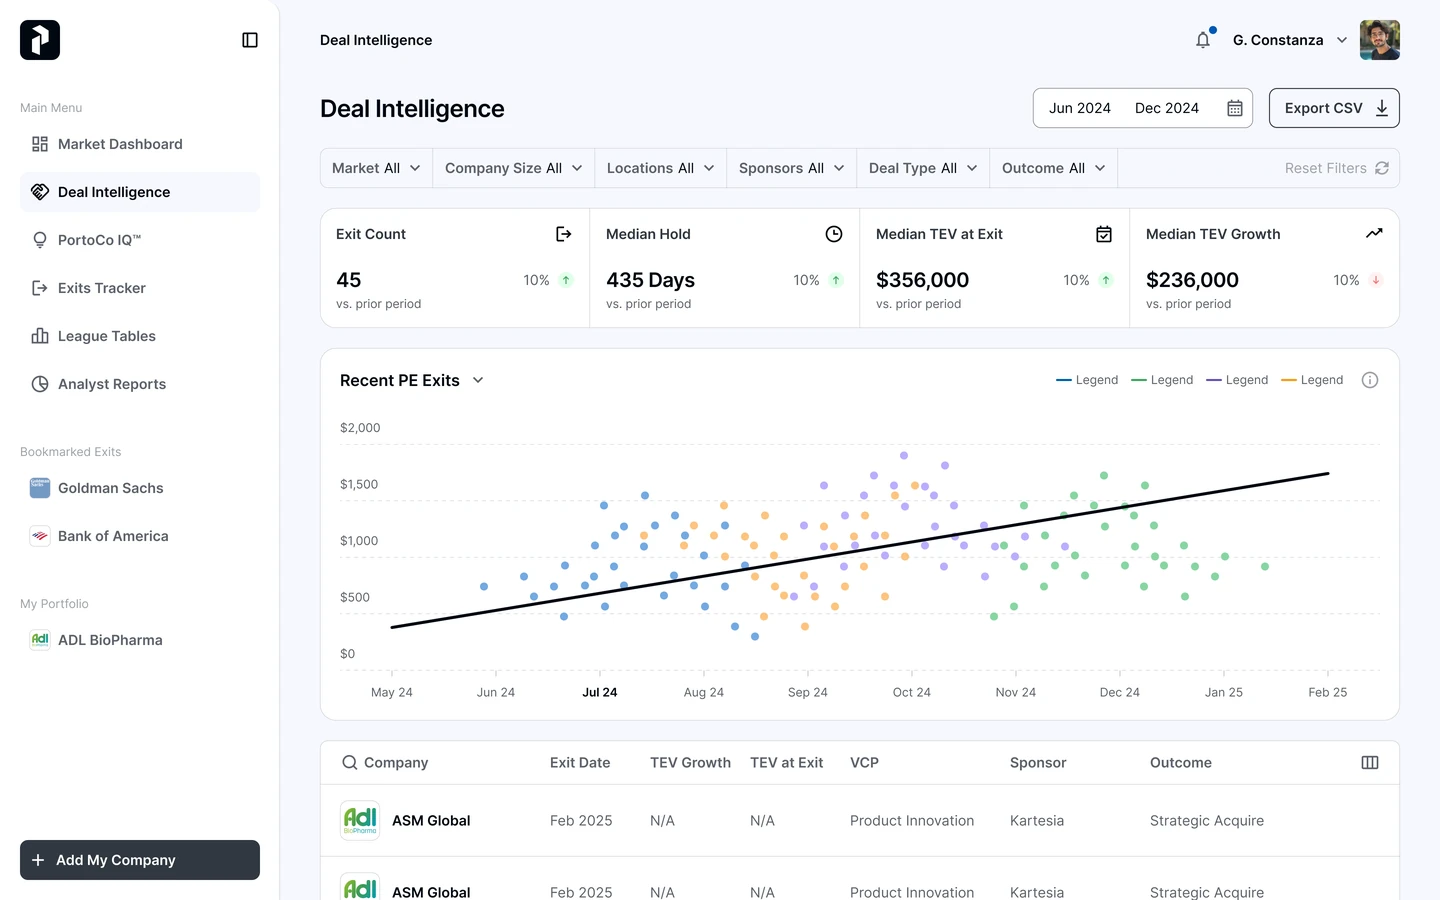
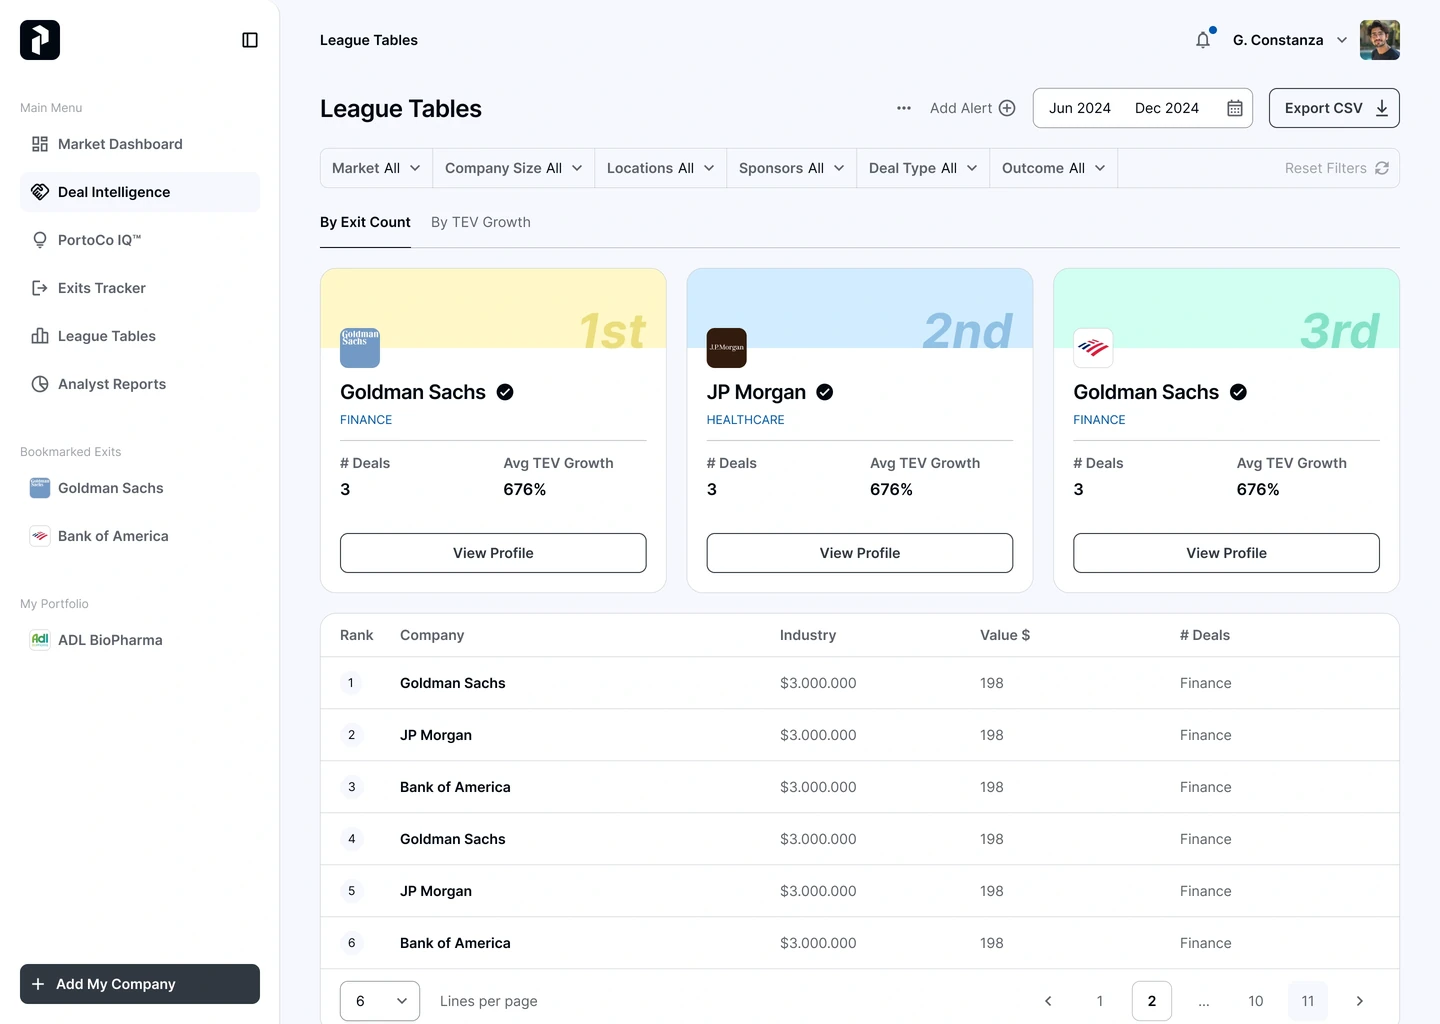
I led UX/UI design for PRIVITAS, connecting market dashboards, deal intelligence and the PortCo IQ score across web and mobile. Research, flows and a shared design system made dense information easier to navigate and inspect.
The challenge
Private-equity teams need to connect exits, deals and portfolio performance without losing the source behind a number. Six dashboards had to work as one product, with clear information hierarchy and usable mobile flows.
Thousands of data points across exits, deals and portfolio health, and every one of them matters to somebody in the room.
Partners will not bet on a number they cannot trace back to the data that produced it, however good the number looks.
Six dense dashboards have to read as one product rather than six separate tools that happen to share a login.
Process
I connected the information structure, user journeys and component system so each dashboard supported a specific decision within one product experience.
Mapped partner decisions and the data behind them in FigJam. This helped separate information that could be summarised from detail that needed to remain accessible.
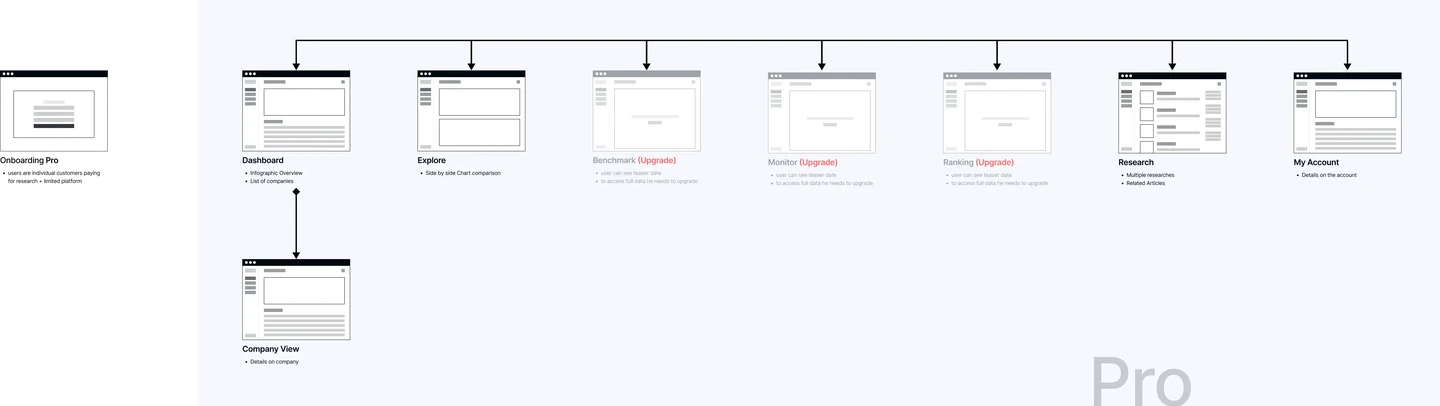
Defined journeys in Figma, from market views to individual portfolio companies across six modules. Designed web and mobile flows together to preserve the same decision path.
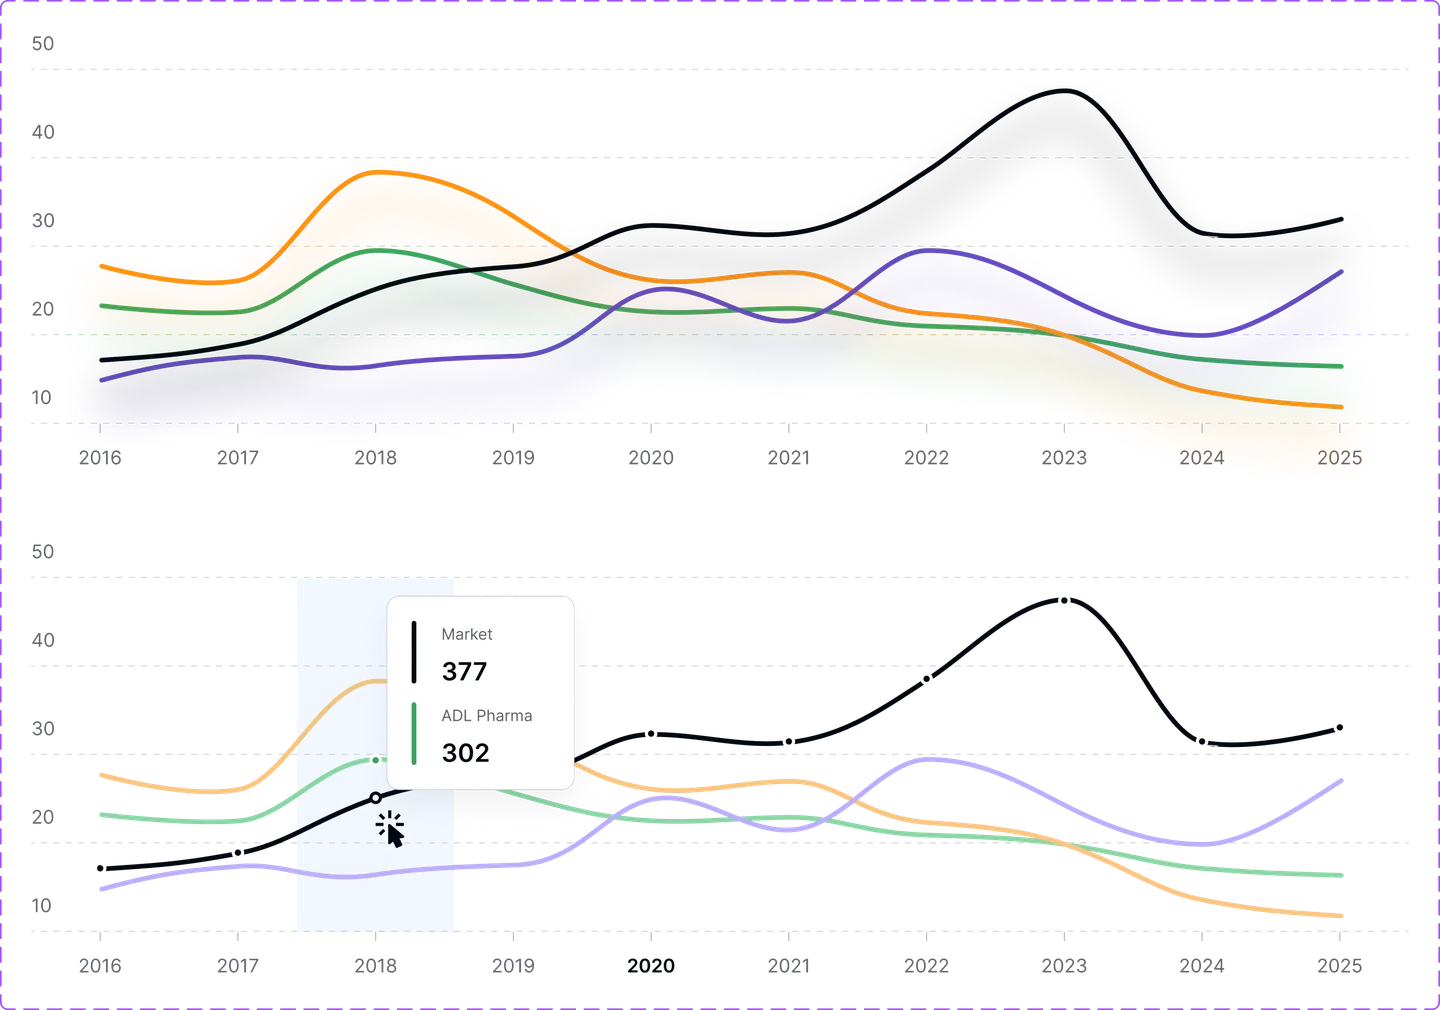
Created KPI cards, charts, filters and tables with Figma variables. Shared components and documented states gave developers a consistent foundation across the dashboards.
Delivered specs through Figma Dev Mode, including mobile behaviour. Implementation reviews helped align the built screens with the intended hierarchy and interactions.
Key decisions
I owned concept development, UX flows, visual design and developer handoff across the analytics platform. This work demonstrates the product thinking behind my building practice: define the decision, structure the data and make the interface clear.
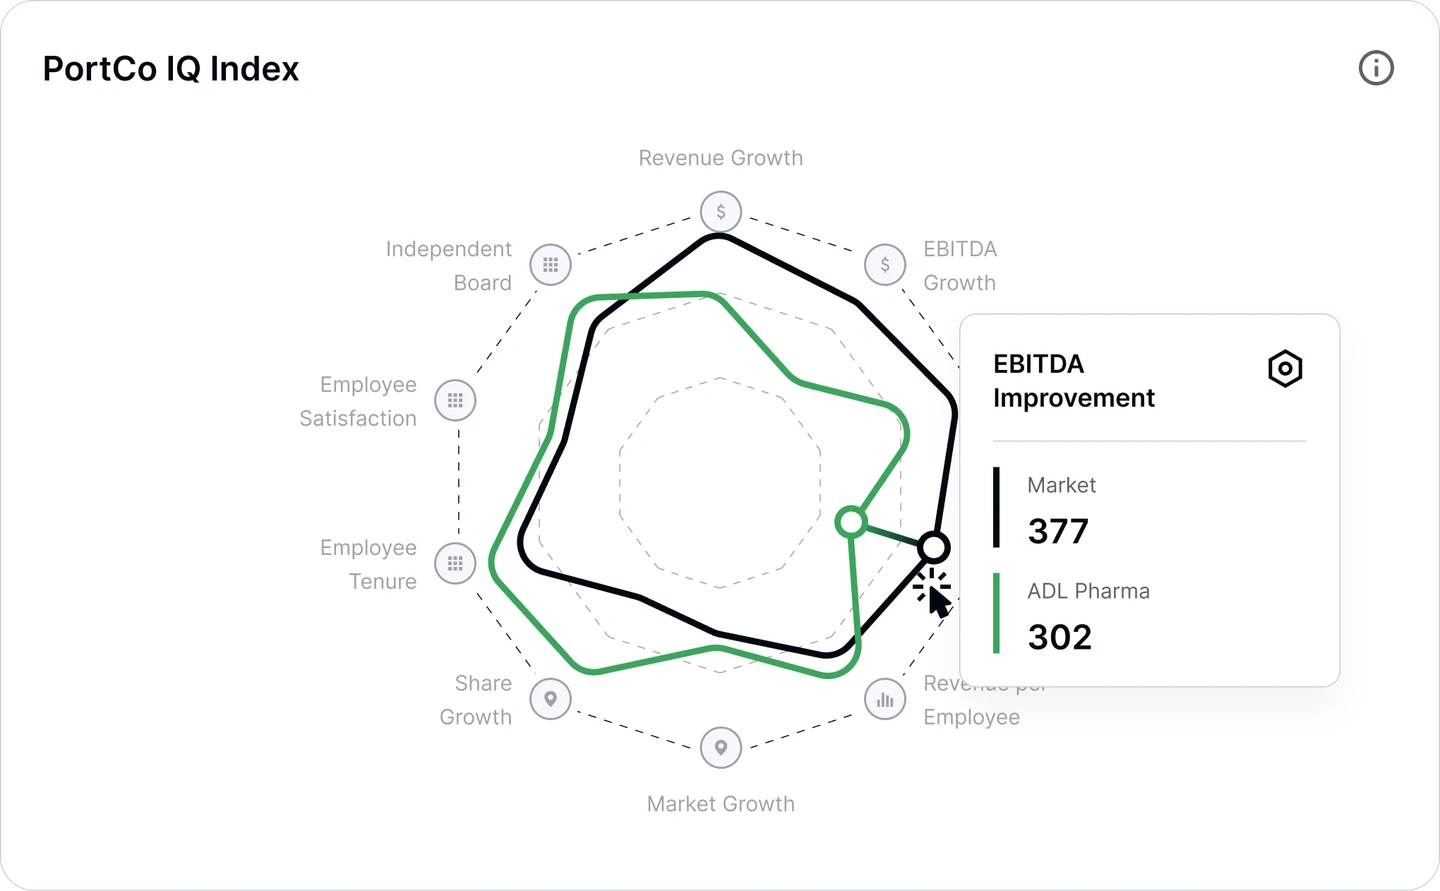
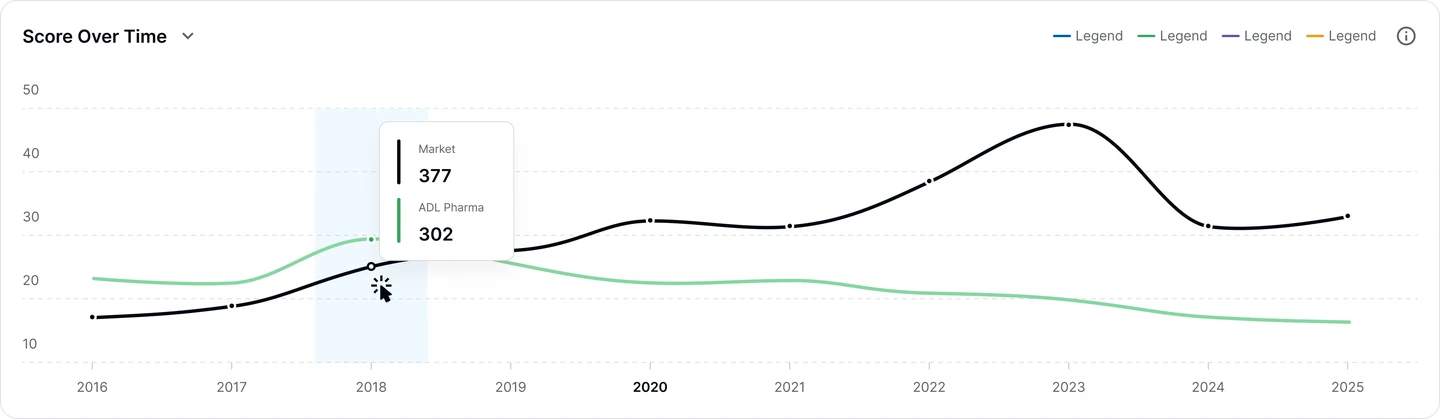
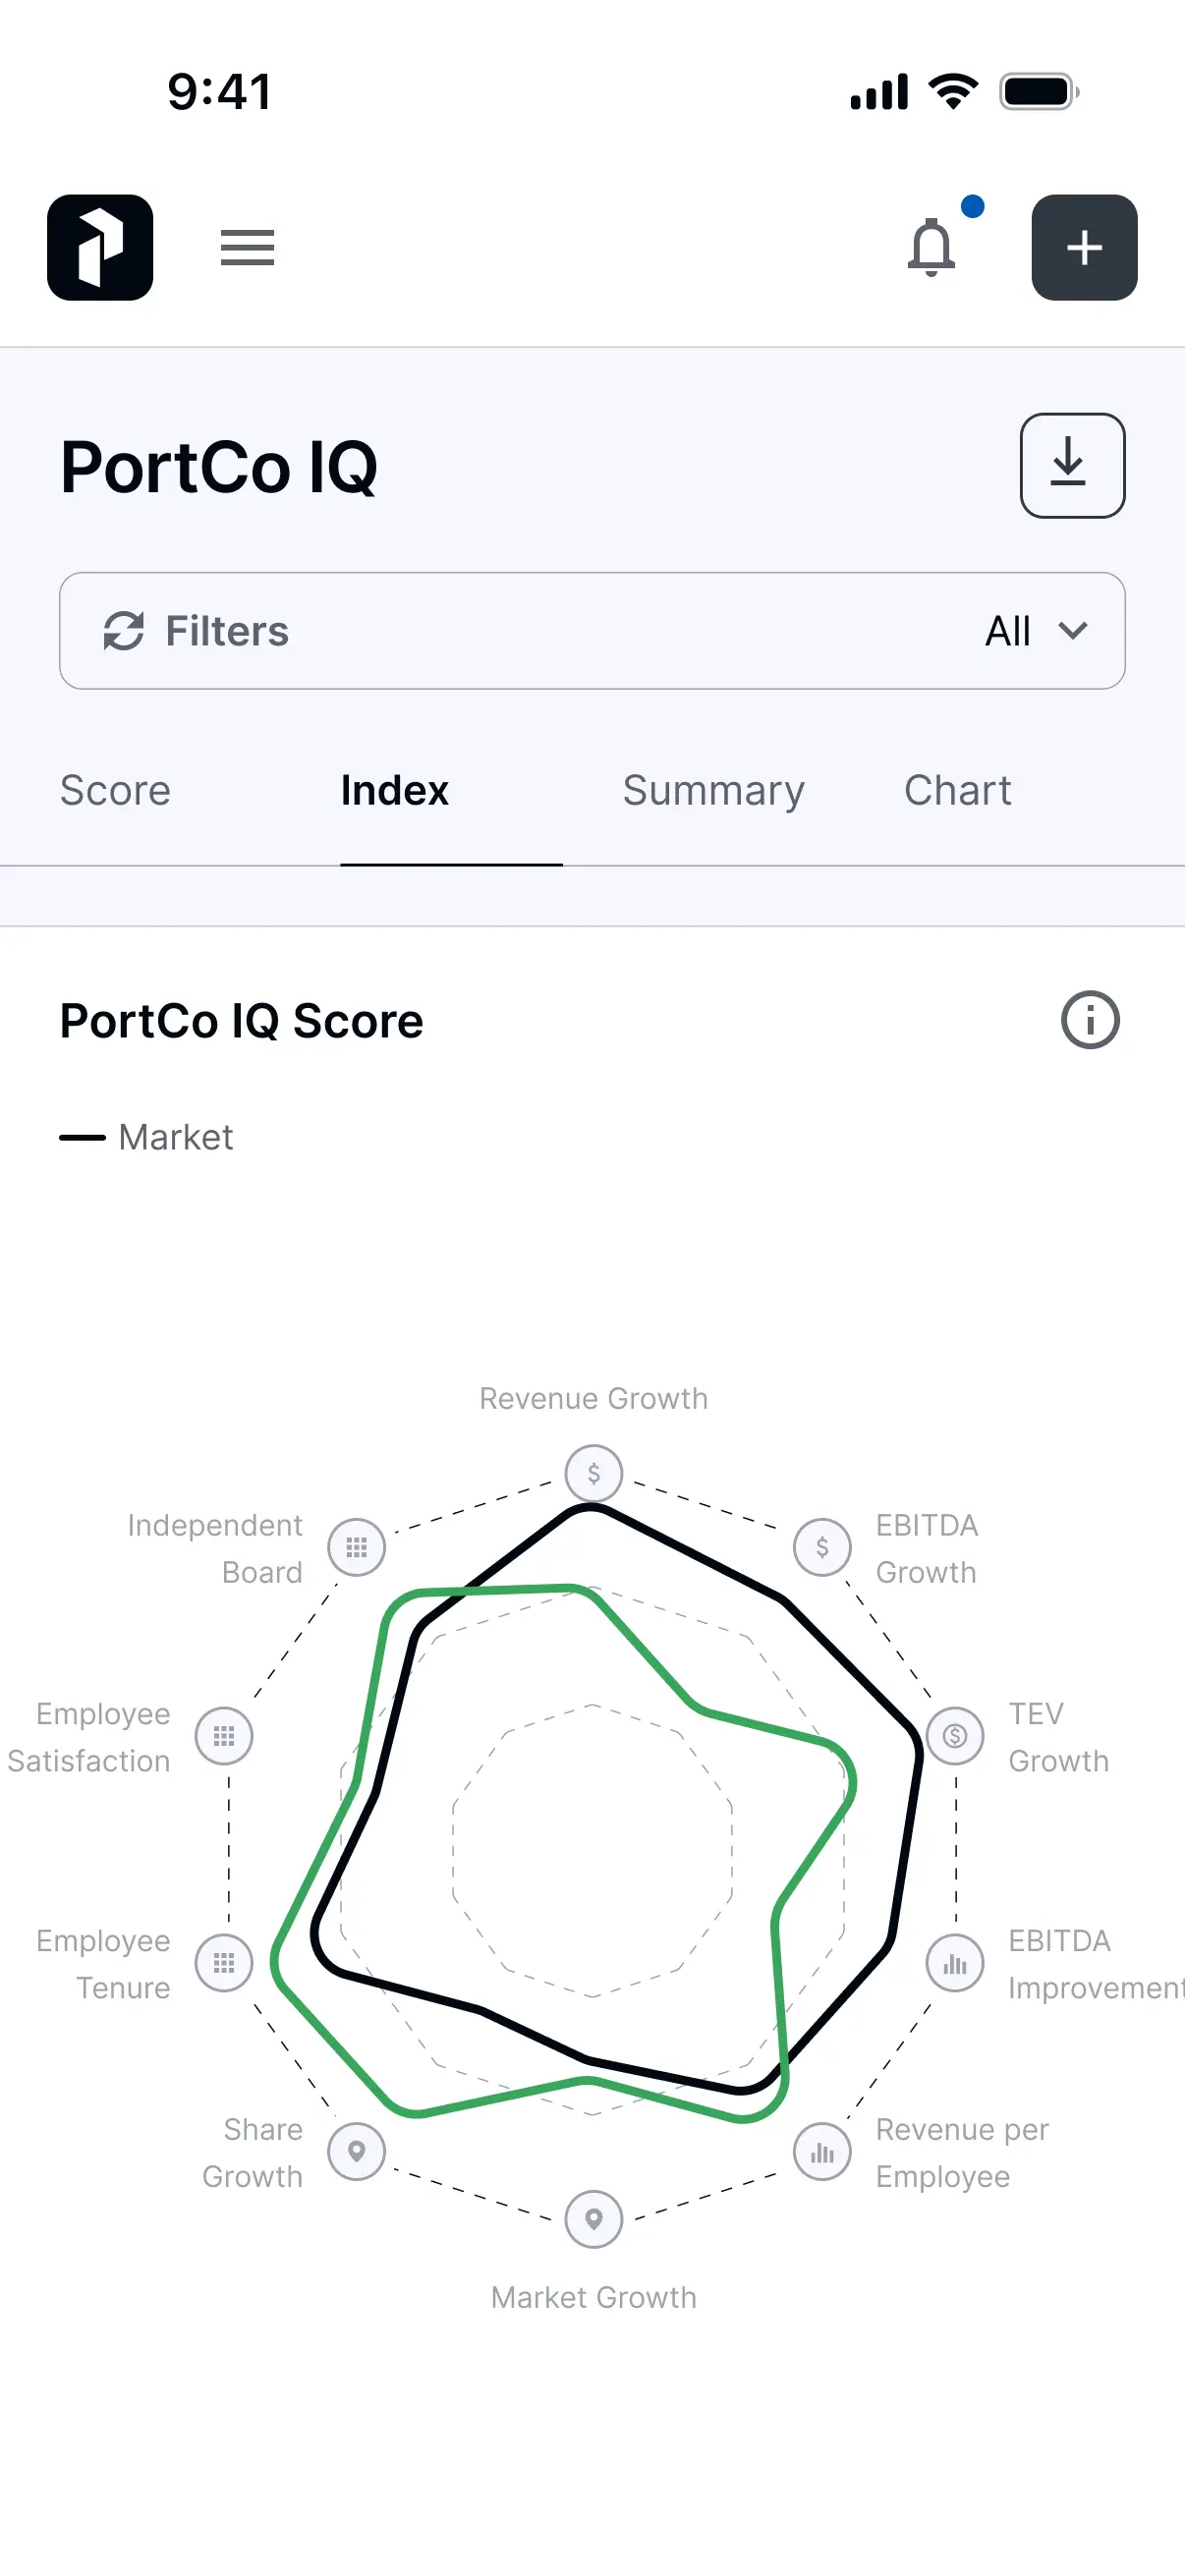
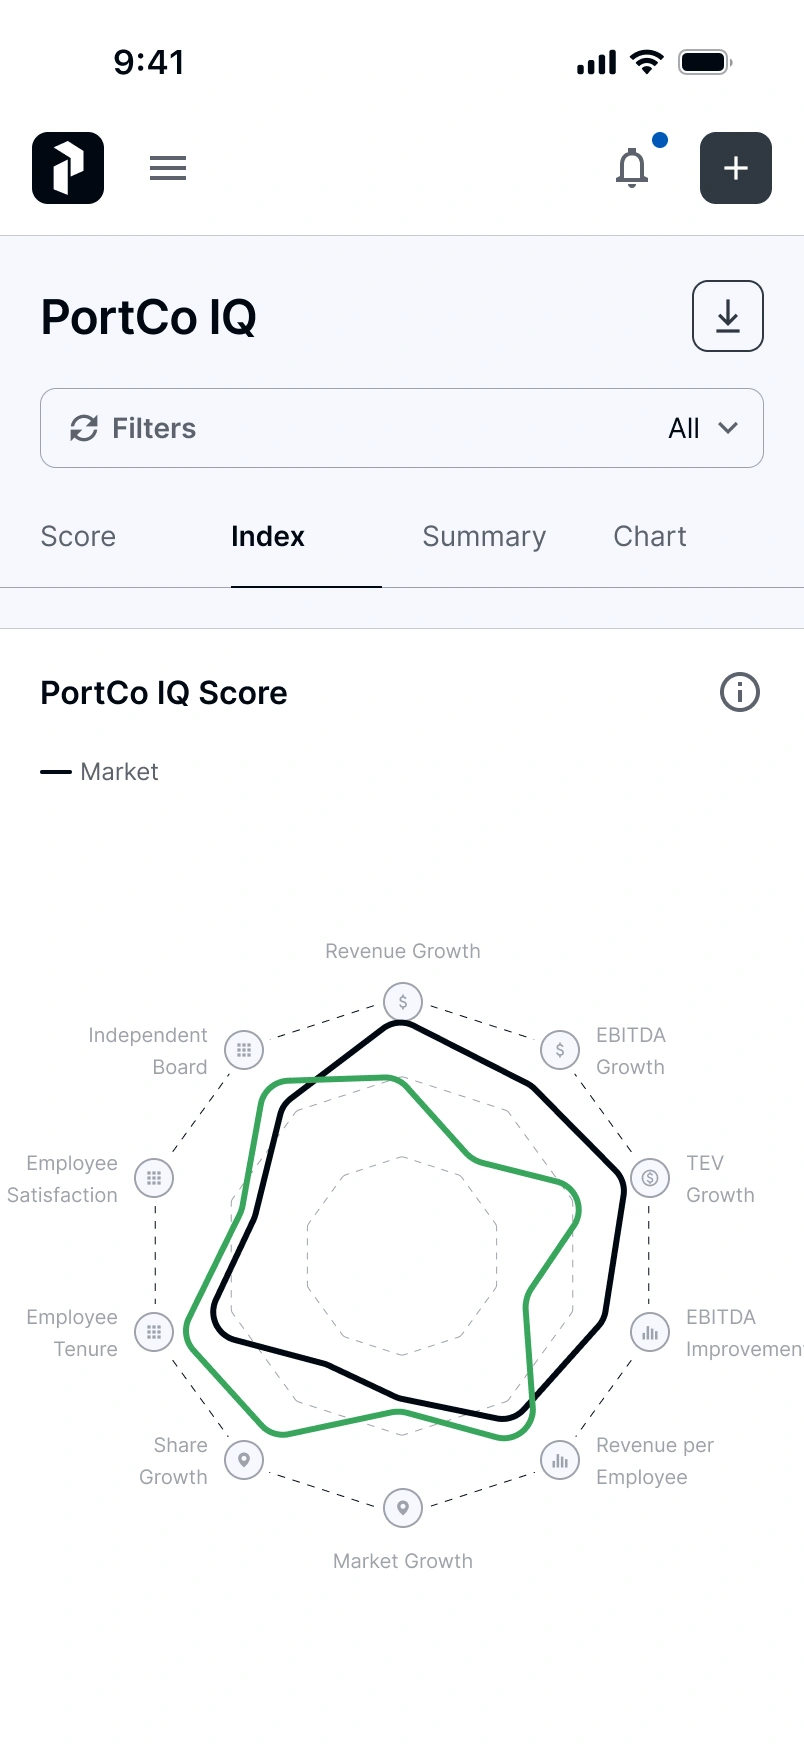
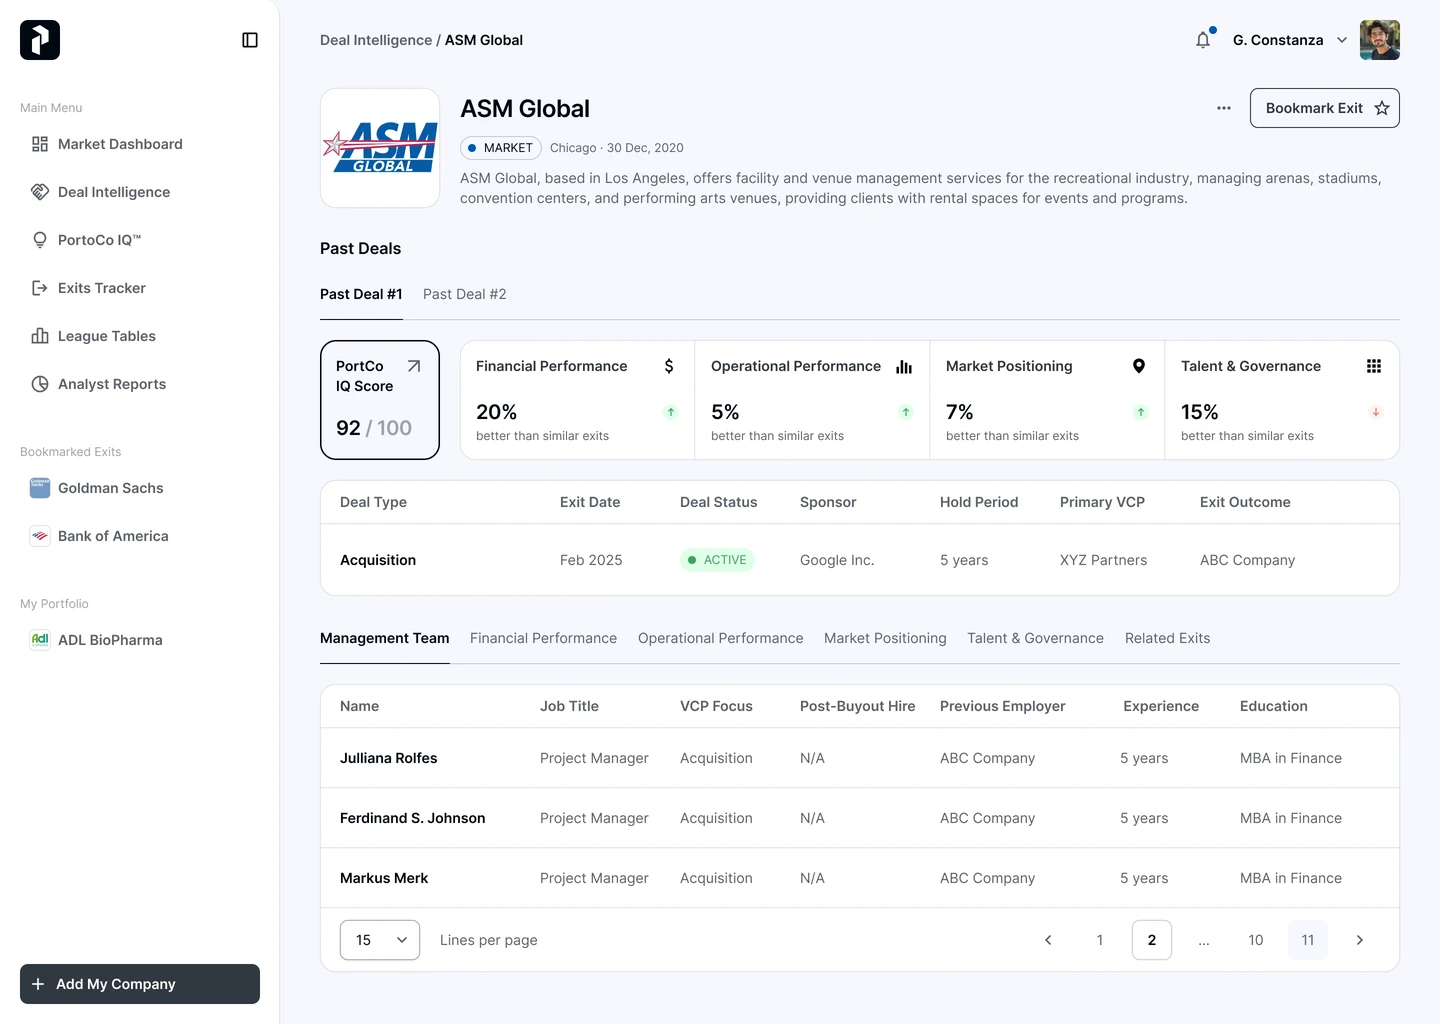
A score out of 100 across ten dimensions, revenue through EBITDA through TEV growth through employee health, so a partner reads portfolio health at a glance then drills in. Any single score hides its own workings, which is why the ten dimensions stayed one tap away.
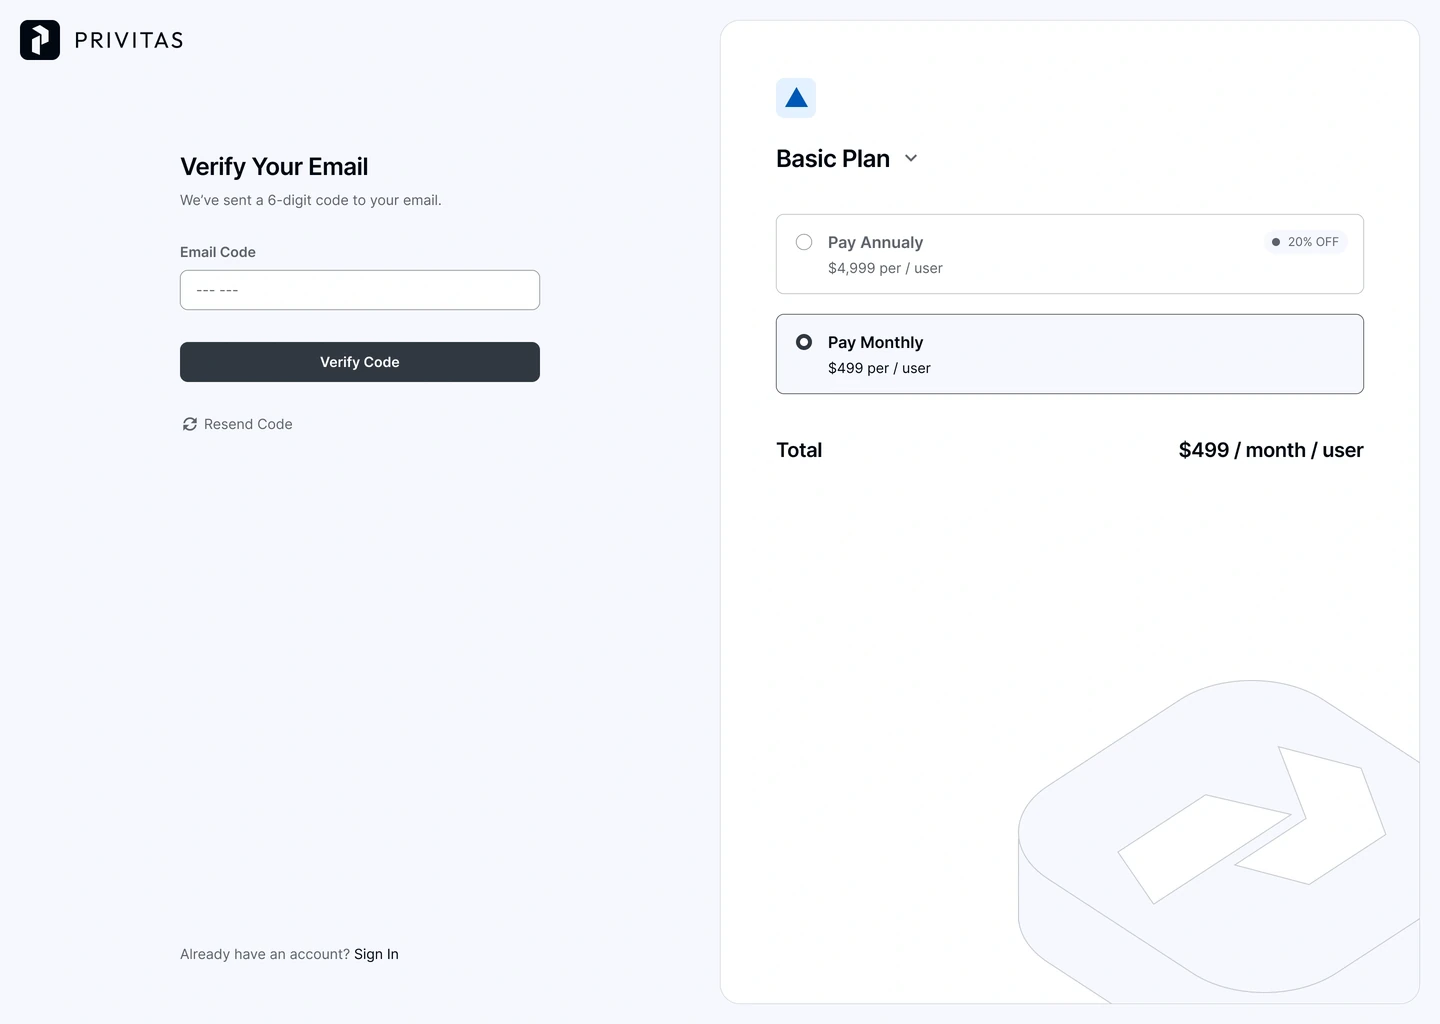
Basic, Pro and Enterprise share the same core modules; only the depth of data changes, and the upgrade is asked for inside the screen rather than on a pricing page. Showing a locked module beats hiding it, as long as the teaser is honest.
Shared charts, filter panels and form controls across all six modules, documented through to handoff. Six dashboards, one product, at the cost of weeks spent on the system rather than on screens.
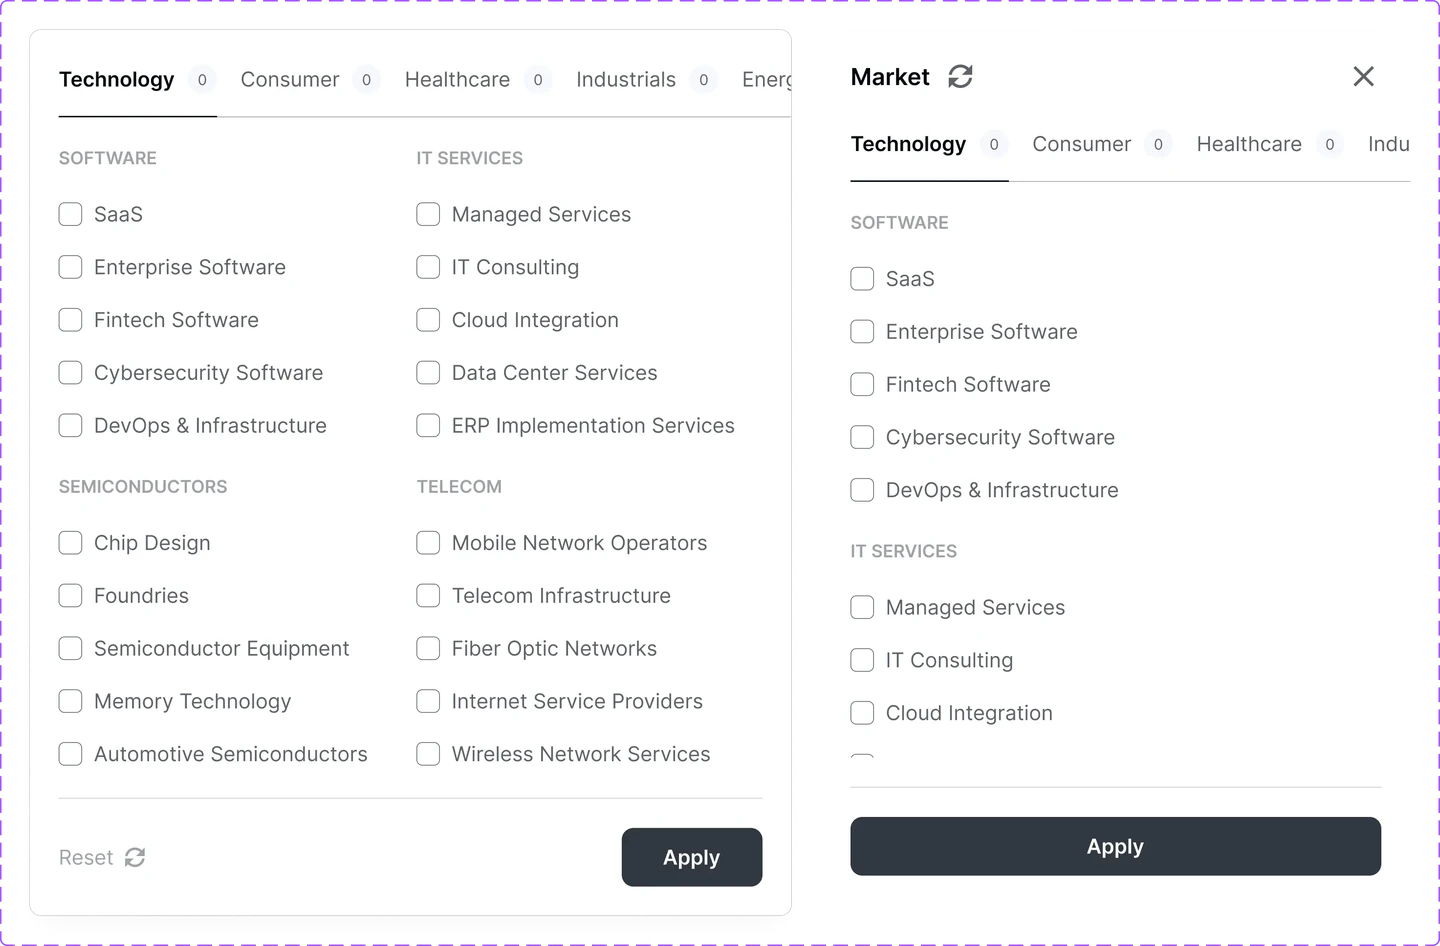
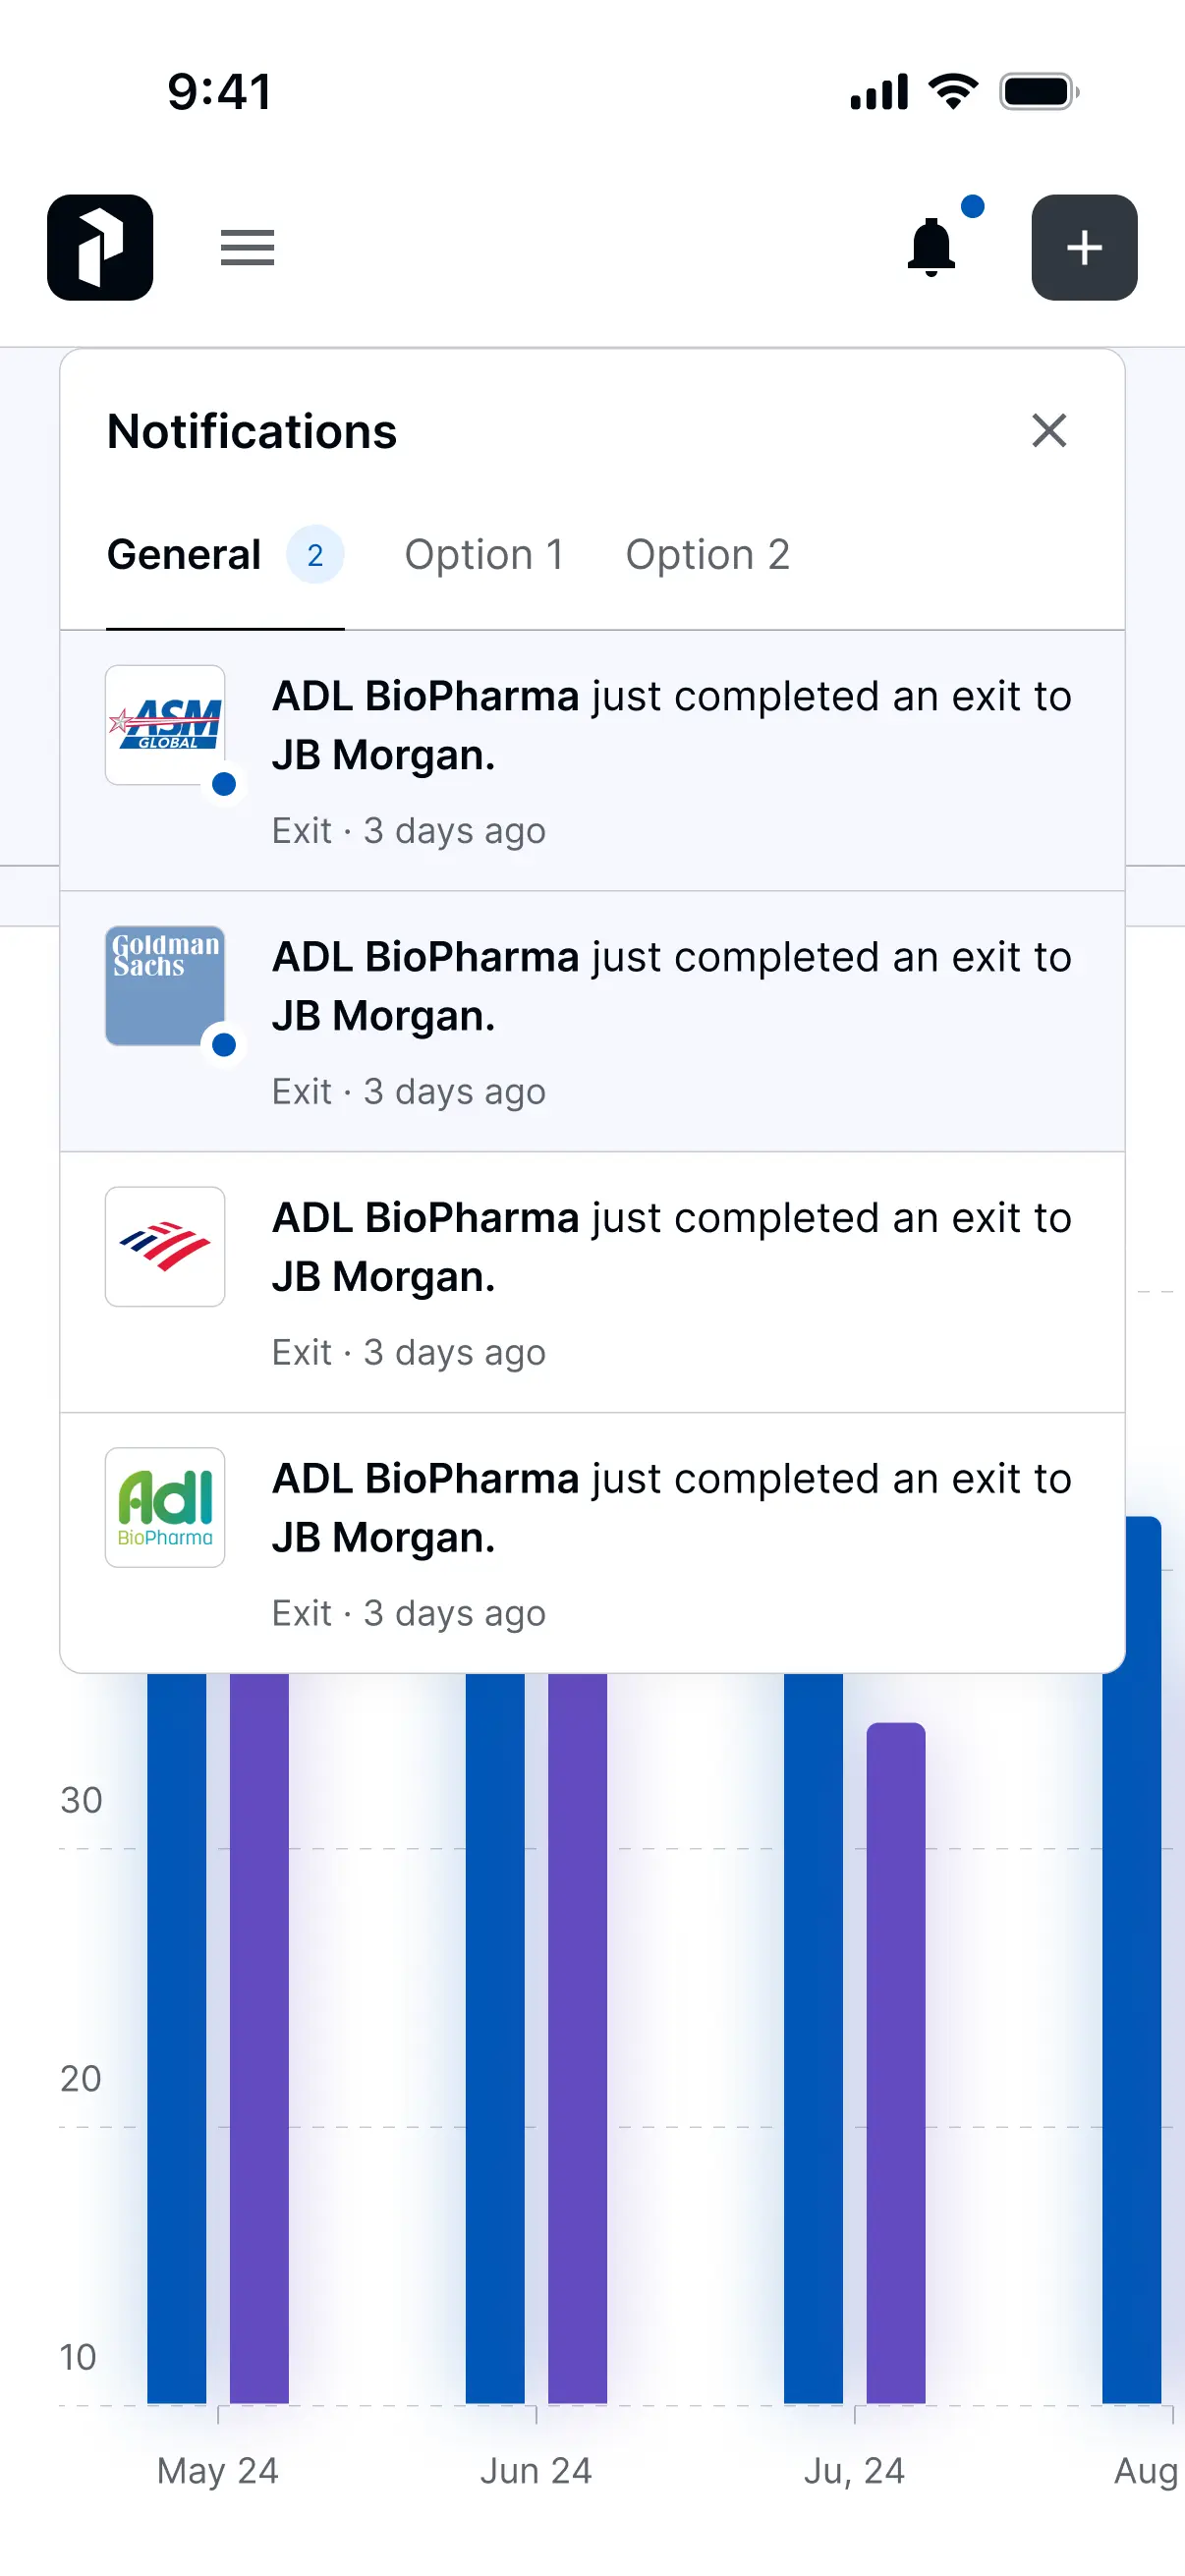
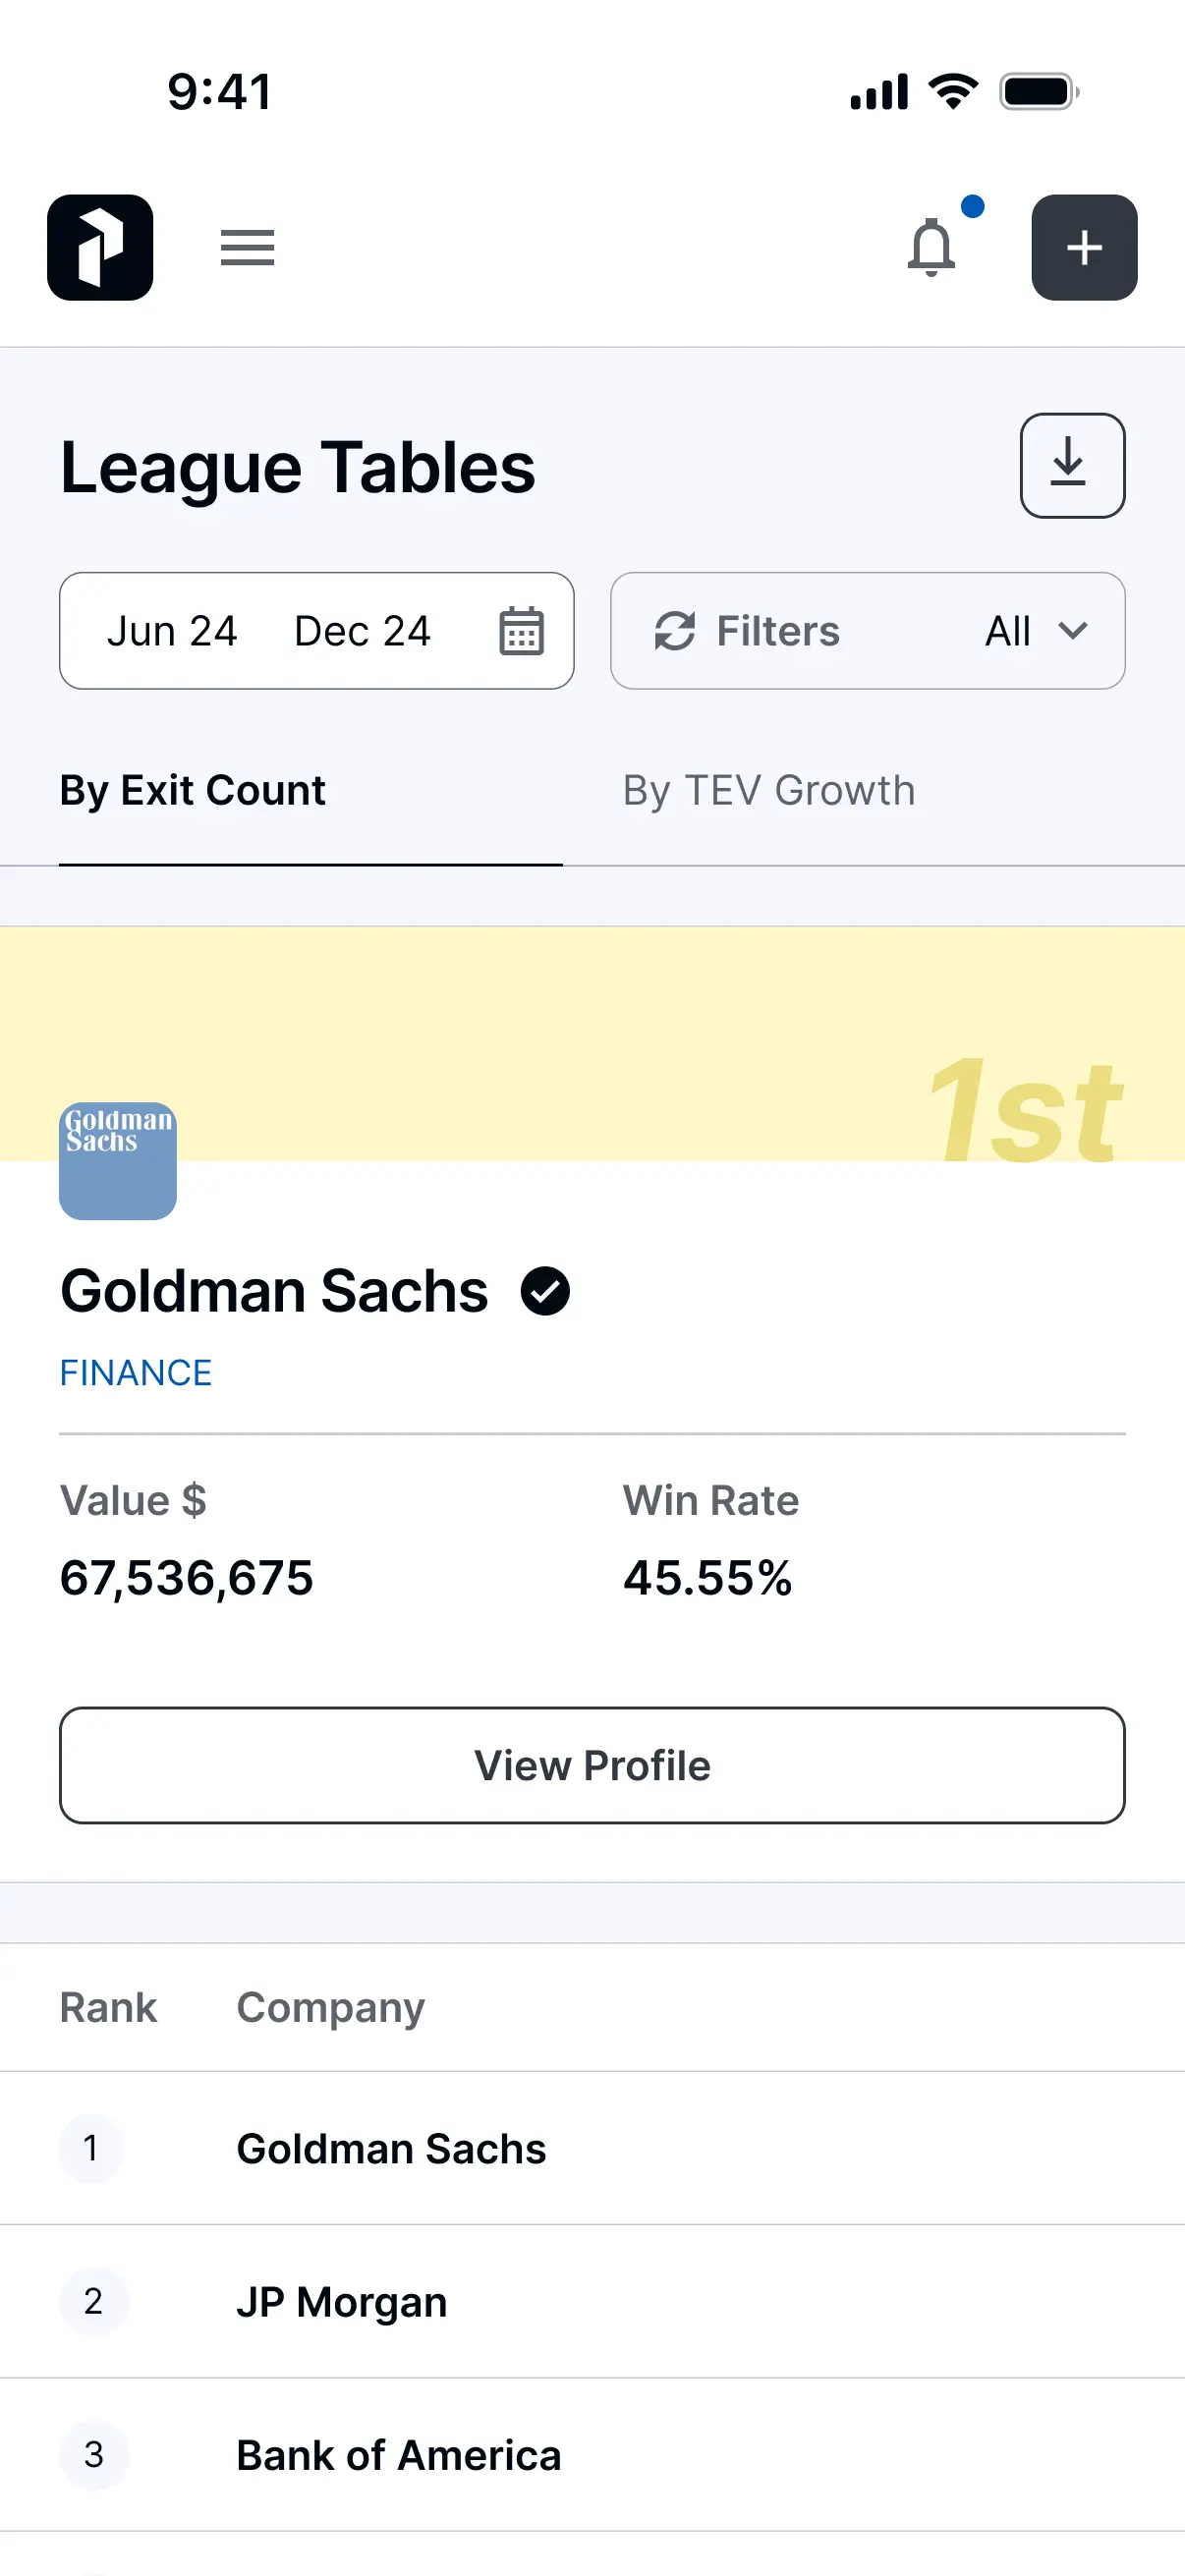
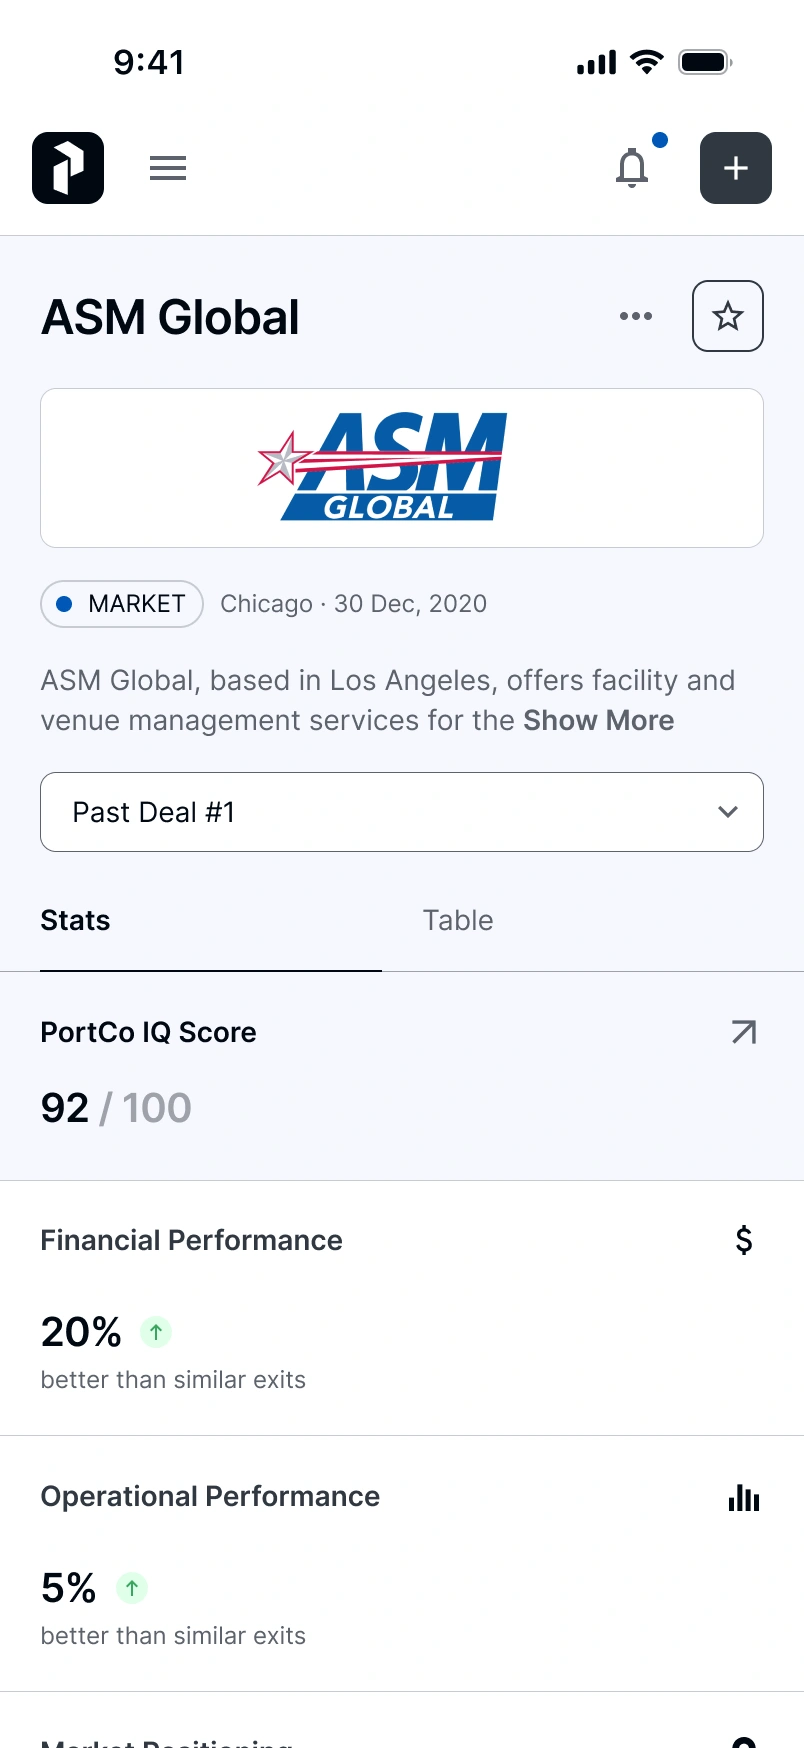
Split each dense dashboard into tabs and added real-time exit alerts, so partners check portfolio health anywhere. Tabs hide relationships that the desktop view shows side by side.
Results
Six data-dense modules, web and mobile, held together by a design system built and documented through to developer handoff.
Data point, module and index figures come from the product's own scope. Adoption numbers will follow once the platform is live.





Reflection
A clear summary is useful only when people can inspect the evidence behind it.
Next, I would measure how often partners inspect the dimensions behind PortCo IQ. That would help establish whether the summary supports deeper analysis and where the drill-down needs to improve.